

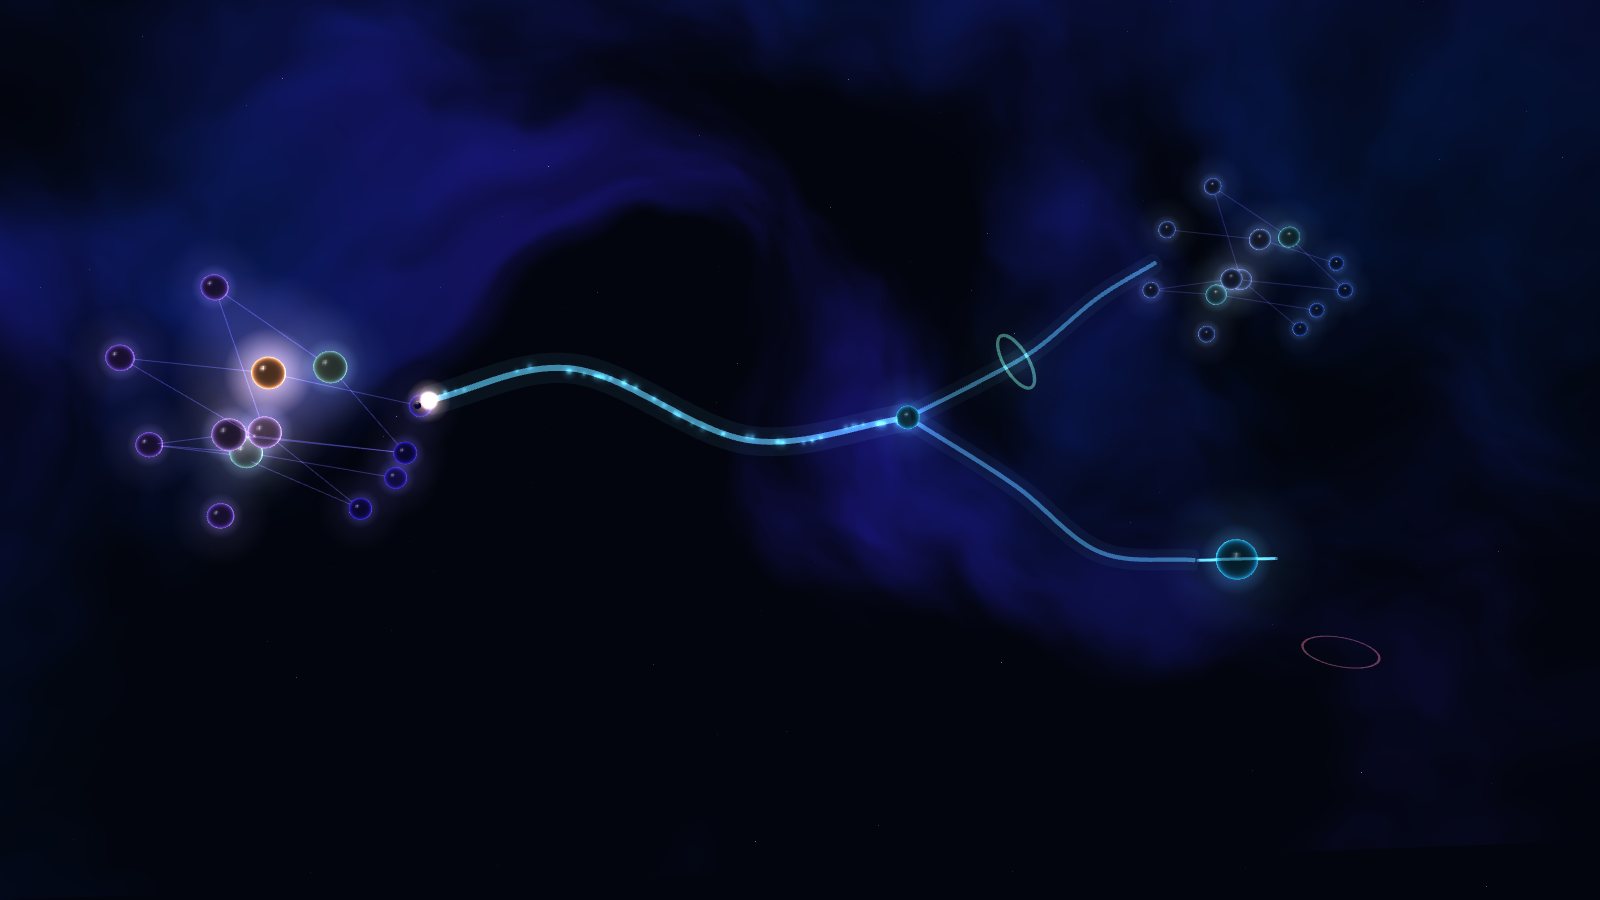
What you are looking at
A small shop database, shop, sits on the left: customers, products and the
orders between them. Every committed transaction leaves it as a frame on its
change stream, the glowing track in the middle. From there it goes two
ways:
- Up to a replica. The green ring is the durability gate. A replica only
applies what is safely on disk at the source, so with
buffereddurability frames wait for the periodic sync and go through in batches. Withgroupthey pass one at a time, a few milliseconds after each commit. - Down to a subscriber. Only the changes the subscription's selector matches become messages. The consumer reads them, acknowledges them, and retries anything it fails. A message that keeps failing is set aside as a dead letter instead of blocking everything behind it.
The animation is slowed down so you can follow it. The panel under the scene has the real timings.
Things to try
- Order fulfilment: press Slow warehouse, add some orders, then resume.
The backlog grows while
shopkeeps committing, and nothing is lost. - Order fulfilment: send a poison message and watch it go round, then land in the dead-letter tray.
- Search index sync: place an order. It goes onto the stream, but the search index never hears about it: the selector only matches products.
- Reporting replica: switch durability between
bufferedandgroupduring a burst, then try to write to the replica. - Undo window: run the bad delete, then pause replication before the delay runs out. Copy the orders back and resync the twin.
The numbers
With group durability we measured a replica catching up a median of 4 ms
after a commit, including one Bolt round trip. With buffered durability, the
Docker image's default, a replica follows the periodic sync (50 ms by default),
so it trails by about 60 ms. Turning a stream on added at most 3.4 % to commit
time in the worst case we measured, a hundred property updates and fifteen
relationships in every transaction; without before-values it added nothing
measurable. Full-row payloads cost about 3 µs for each matching entity.
Measured on an Intel Core i9-13900K with 64 GB of RAM, running the published Linux image under Docker 28 on Windows 11.